模型正则化:限制参数的大小
一个过拟合的例子:
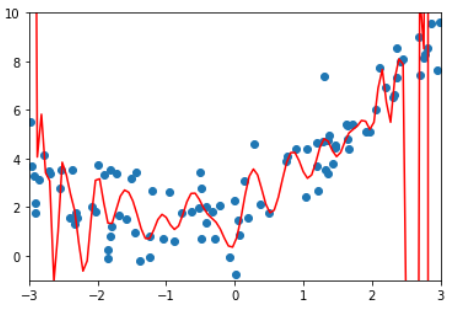
这是8-3中的一个过拟合的例子,把模型的参数打出来如下:

为了尽量地拟合数据,使得线条非常陡峭,数学上表示就是系数非常大
岭回归 Ridge Regularization

Note 1: 正则项是从1累加到n的,theta 0不在里面,因为theta 0代表偏移,不是真正的系数。
Note 2:系数1/2加不加都可以,加了是为了求导方便。
Note 3:a是一个新的超参数,表示目标函数中模型正则化的程度。
代码实现
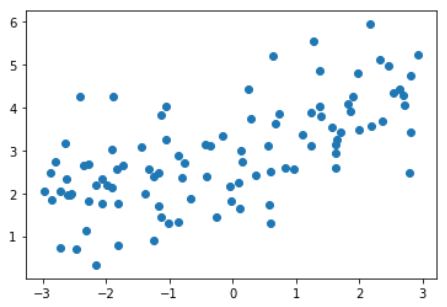
测试数据
import numpy as np
import matplotlib.pyplot as plt

np.random.seed(42)
x = np.random.uniform(-3.0, 3.0, size=100)
X = x.reshape(-1, 1)
y = 0.5 * x + 3 + np.random.normal(0, 1, size=100)

plt.scatter(X, y)
plt.show()
多项式回归,degree = 20
训练模型
from sklearn.pipeline import Pipeline
from sklearn.preprocessing import PolynomialFeatures
from sklearn.preprocessing import StandardScaler
from sklearn.linear_model import LinearRegression

def PolynomialRegression(degree):
    return Pipeline([
        ("poly", PolynomialFeatures(degree=degree)),
        ("std_scaler", StandardScaler()),
        ("lin_reg", LinearRegression())
    ])

from sklearn.model_selection import train_test_split
np.random.seed(666)
X_train, X_test, y_train, y_test = train_test_split(X, y)

from sklearn.metrics import mean_squared_error

poly_reg = PolynomialRegression(degree=20)
poly_reg.fit(X_train, y_train)
绘制模型
def plot_model(model):
    X_plot = np.linspace(-3, 3, 100).reshape(100, 1)
    y_plot = model.predict(X_plot)

    plt.scatter(x, y)
    plt.plot(X_plot[:,0], y_plot, color='r')
    plt.axis([-3, 3, 0, 6])
    plt.show()
训练效果
y_predict = poly_reg.predict(X_test)
mean_squared_error(y_test, y_predict)   # MSE = 167.94010867772357
plot_model(poly_reg)
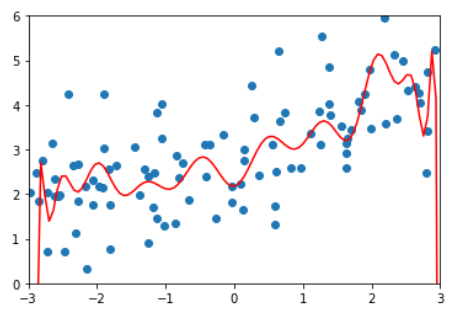
岭回归,degree=20, alpha = 0.0001
训练模型
from sklearn.linear_model import Ridge
from sklearn.pipeline import Pipeline
from sklearn.preprocessing import PolynomialFeatures
from sklearn.preprocessing import StandardScaler
from sklearn.linear_model import LinearRegression

def RidgeRegression(degree, alpha):
    return Pipeline([
        ("poly", PolynomialFeatures(degree=degree)),
        ("std_scaler", StandardScaler()),
        ("ridge_reg", Ridge(alpha=alpha))
    ])

ridge1_reg = RidgeRegression(20, 0.0001)
ridge1_reg.fit(X_train, y_train)
训练效果
y1_predict = ridge1_reg.predict(X_test)
mean_squared_error(y_test, y1_predict)   # MSE = 1.3233492754136291
plot_model(ridge1_reg)
多项式回归及岭回归不同参数的训练结果比较
| MSE | 拟合曲线
--|---|--
多项式回归,degree = 20 | 167.94010867772357 |
岭回归,degree=20, alpha = 0.0001 | 1.3233492754136291 |
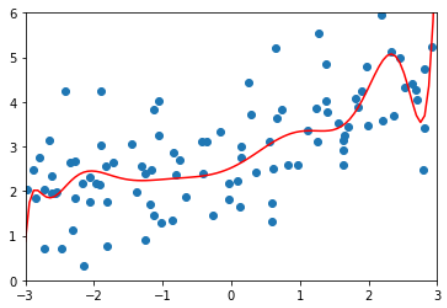
岭回归,degree=20, alpha = 1 | 1.1888759304218461 | 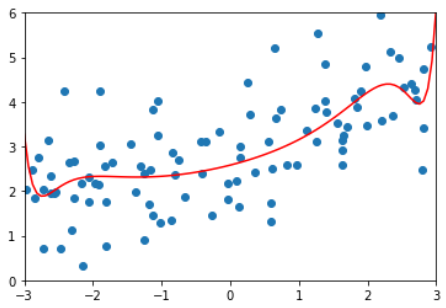 岭回归,degree=20, alpha = 100 | 1.3196456113086197 |
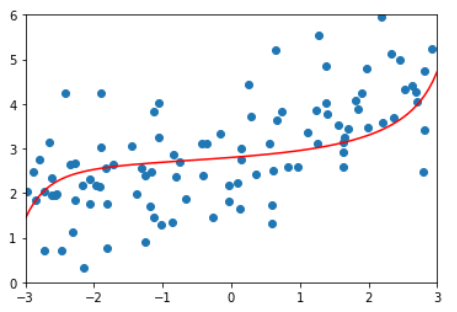
岭回归,degree=20, alpha = 10000000 | 1.840889124848122 | 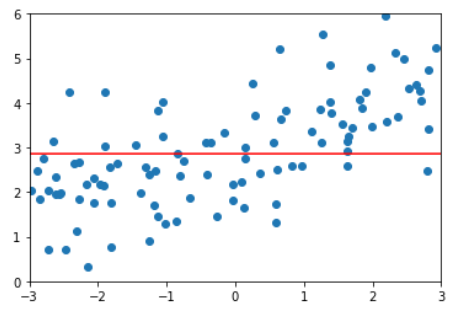
当a非常大时,本质上成了优化正则表达项,即让所有theta=0