ROC:Receiver Operation Characteristic Curve
ROC曲线描述TPR和FPR之间的关系。
TPR = recall = TP / (TP + FN) # true positive rate FPR = FP / (FP + TN) # false positive rate
TPR和FPR的关系如图:

TPR和FRP呈现相一致的趋势
代码
回顾前面学过的代码
def TN(y_true, y_predict):
    assert len(y_true) == len(y_predict)
    return np.sum((y_true == 0) & (y_predict==0))   # 注意这里是一个‘&’

def FP(y_true, y_predict):
    assert len(y_true) == len(y_predict)
    return np.sum((y_true == 0) & (y_predict==1))

def FN(y_true, y_predict):
    assert len(y_true) == len(y_predict)
    return np.sum((y_true == 1) & (y_predict==0))

def TP(y_true, y_predict):
    assert len(y_true) == len(y_predict)
    return np.sum((y_true == 1) & (y_predict==1))

def confusion_matrix(y_true, y_predict):
    return np.array([
        [TN(y_true, y_predict), FP(y_true, y_predict)],
        [FN(y_true, y_predict), TP(y_true, y_predict)]
    ])

def precision_score(y_true, y_predict):
    tp = TP(y_true, y_predict)
    fp = FP(y_true, y_predict)
    try:
        return tp / (tp + fp)
    except:   # 处理分母为0的情况
        return 0.0

def recall_score(y_true, y_predict):
    tp = TP(y_true, y_predict)
    fn = FN(y_true, y_predict)

    try:
        return tp / (tp + fn)
    except:
        return 0.0
TPR和FPR
def TPR(y_true, y_predict):
    tp = TP(y_true, y_predict)
    fn = FN(y_true, y_predict)

    try:
        return tp / (tp + fn)
    except:
        return 0.0

def FPR(y_true, y_predict):
    fp = FP(y_true, y_predict)
    tn = TN(y_true, y_predict)

    try:
        return fp / (fp + tn)
    except:
        return 0.0
加载测试数据
import numpy as np
from sklearn import datasets

digits = datasets.load_digits()
X = digits.data
y = digits.target.copy()

y[digits.target==9] = 1
y[digits.target!=9] = 0

from sklearn.model_selection import train_test_split
X_train, X_test, y_train, y_test = train_test_split(X, y, random_state=666)

from sklearn.linear_model import LogisticRegression

log_reg = LogisticRegression()
log_reg.fit(X_train, y_train)
绘制TFP和FRP的曲线,即ROC
decision_scores = log_reg.decision_function(X_test)
import matplotlib.pyplot as plt

fprs = []
tprs = []

thresholds = np.arange(np.min(decision_scores), np.max(decision_scores), step=0.1)
for threshold in thresholds:
    y_predict = np.array(decision_scores >= threshold, dtype='int')
    fprs.append(FPR(y_test, y_predict))
    tprs.append(TPR(y_test, y_predict))

plt.plot(fprs, tprs)
plt.show()

sklearn中的ROC曲线
from sklearn.metrics import roc_curve

fprs, tprs, thresholds = roc_curve(y_test, decision_scores)
plt.plot(fprs, tprs)
plt.show()
我们通常关注这条曲线下面的面积。面积越大,说明分类的效果越好。
ROC score
ROC score代码曲线下面的面积。
auc = area under curl
from sklearn.metrics import roc_auc_score
roc_auc_score(y_test, decision_scores)
输出:0.9830452674897119
总结
对于有偏数据,观察它的精准率和召回率是非常有必要的。
但是ROC曲线对有偏数据并不敏感,它主要用于比较两个模型的孰优孰劣。
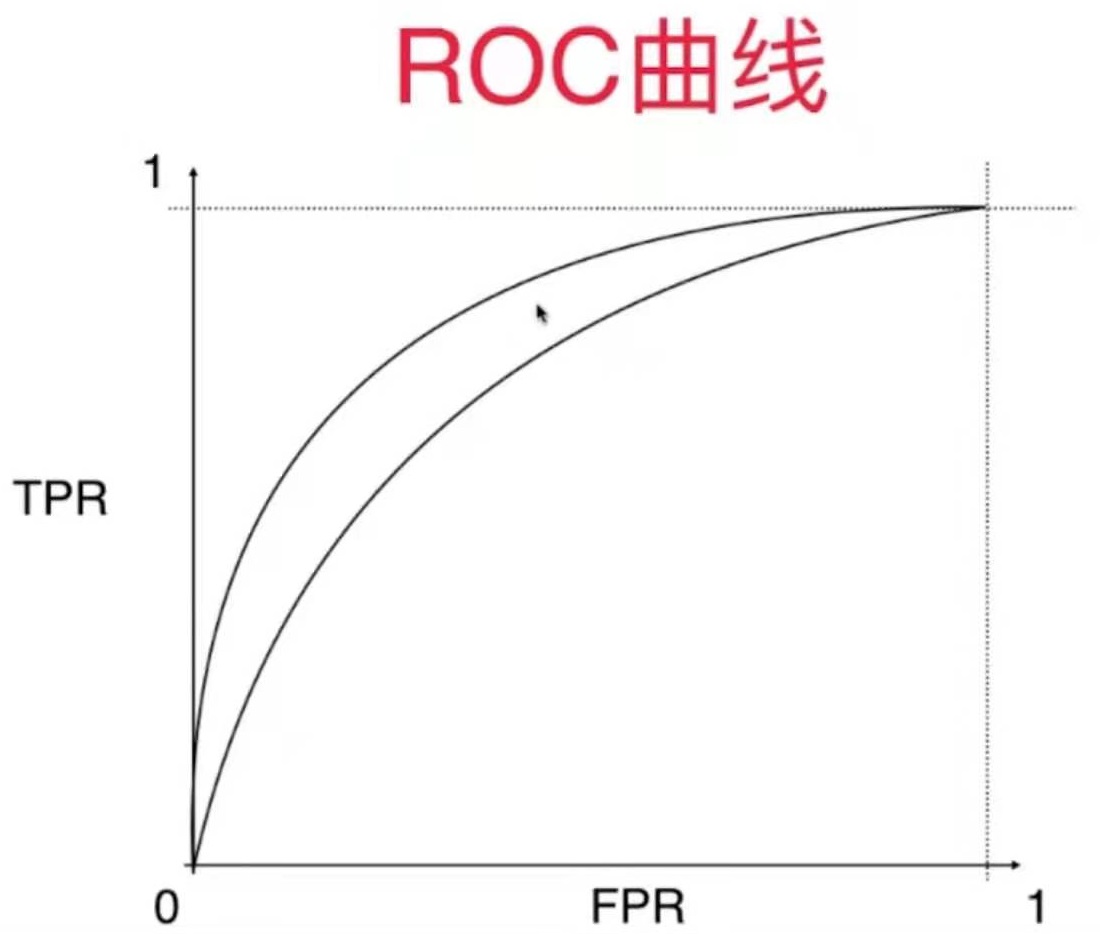
如果两根曲线分别代码两个模型的ROC曲线,在这种情况下我们会选择外面那根曲线对应模型。